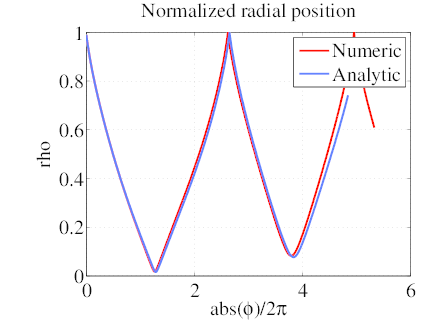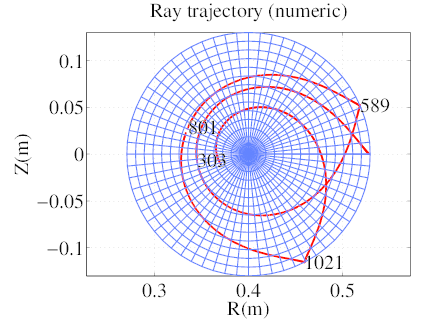
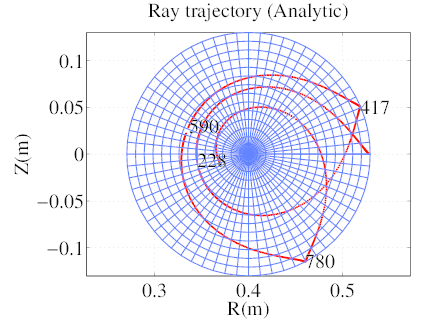
Figure 7: Poloidal projection of the ray trajectory. The red curve corresponds to the
slow mode and the blue curve corresponds to the fast mode. Numeric (upper plot) and
analytic (lower plot) magnetic equilibrium. VERSATOR II. N∥0 = 5.0.
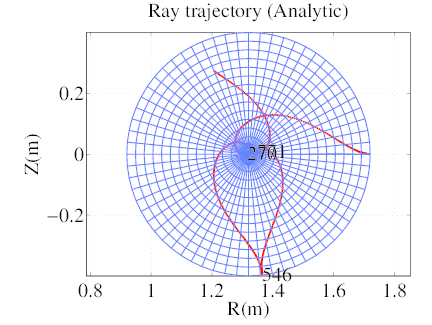
Lower Hybrid heating and current drive simulations have been performed for the VERSATOR II and PLT tokamaks, which both have almost circular concentric magnetic flux surfaces [1, 10]. For the sake of benchmarking, the Shafranov shift is neglected, and a plasma with exact circular concentric magnetic flux surfaces is considered with the following magnetic equilibrium parameters
 | (172) |
and the following profiles
 | (173) |
with
 | (174) |
In the calculations, the scrape-off layer is not considered, since the specular reflection is enforced if needed on the last closed magnetic surface for the Lower Hybrid wave.
For both tokamaks, Zeff is uniform with Zeff = 4 for VERSATOR II and Zeff = 2 for PLT. The plasma is made of hydrogen ions for VERSATOR II and deuterium ions for PLT. For both machines, a fully stripped single impurity species is considered, using carbon ions with mc = 12, Zc = 6.
The magnetic equilibrium is characterized by a parabolic safety factor profile
 | (175) |
The poloidal flux coordinate ψ is then
 | (176) |
which leads to
 | (177) |
In the simulations, qmin = 1, and qmax is obtained from Ampère’s law.
For both tokamaks, the ray is launched in the slow mode from the position
 | (178) |
with the spectral properties
 | (179) |
The non-zero m0 arises from the fact that simulations in references [1] [10] use m0 = 0 in the scrape-off layer and not at ψ = ψa.
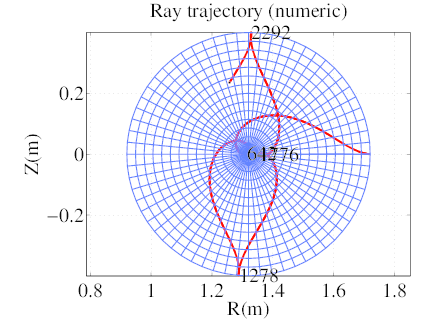
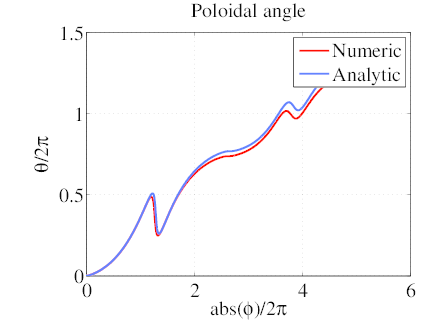
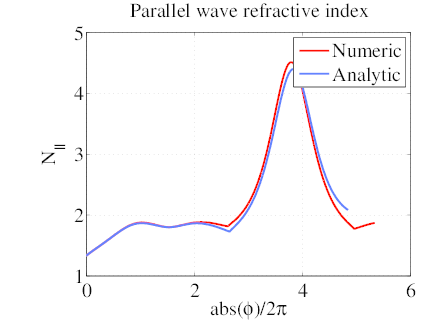
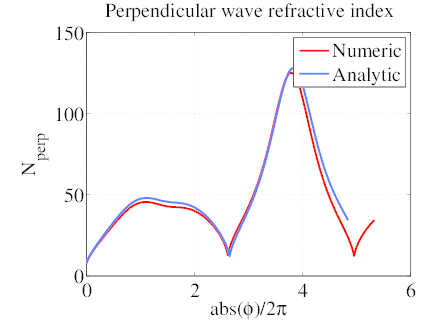
The results are plotted in figures 7-12. A good agreement is found with references [1] and [10] despite differences in the magnetic equilibrium. An excellent agreement is found between numerical and analytical magnetic equilibrium for the case of VERSATOR II where the ray never approaches the plasma center.
The difference arises from a cumulative error that becomes more important when the ray approaches the plasma center. Yet the effect on the wave power and current deposition generally remains negligible.